Globalization Worksheet
This globalization worksheet gives Grade 12 students 26 marks of practice on how economies became integrated and who gained from it.
This globalization worksheet gives Grade 12 students 26 marks of practice on how economies became integrated, who gained from it, and what happens when a government tries to pull back.
What the globalization worksheet covers
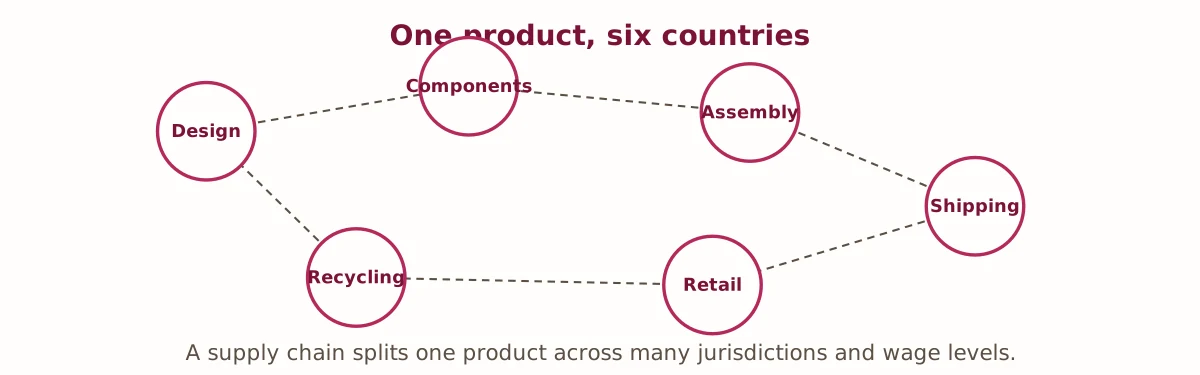
The clearest way to see globalization is to follow one object. A phone is designed in one country, built from components made in three more, assembled in a fifth, shipped through a sixth and sold in a hundred. Part D asks students to trace that chain across the diagram and to say what a firm gains and what it risks by splitting production this way.
The gain is straightforward: each stage happens wherever it is cheapest, fastest or most specialized. The risk is the same fact seen from the other side — one broken link stops everything. A port closure, a tariff change, a political dispute or a single failed supplier can halt a product that nothing is otherwise wrong with.
Comparative advantage and its limits
The economic argument for arranging the world this way is comparative advantage: if each place specializes in what it produces relatively cheaply and trades for the rest, total output rises. The evidence that output did rise is strong, and so is the evidence that hundreds of millions of people left extreme poverty as manufacturing spread across Asia.
Part C asks students to sort six claims into arguments for and against. The design matters here: the arguments against are not that the gains are imaginary. They are that the gains are distributed unevenly and that the system is fragile. Manufacturing regions in wealthy countries lost work faster than replacements appeared. Firms can relocate to wherever standards and wages are lowest. And a shock in one country now reaches the whole chain within weeks rather than years.
Sorting claims rather than arguing a side keeps this analytical. A senior student should be able to state the strongest version of both cases before deciding what they think, and the sort forces that.
Who actually pays for a tariff
Part E is the question most worth marking carefully. A government raises tariffs to protect a domestic industry: who gains and who loses? The protected industry and its workers gain, because less competition lets them hold higher prices and keep output. Consumers lose, paying those higher prices on every unit. Exporters lose twice, because their inputs cost more and trading partners often retaliate against goods that had nothing to do with the original dispute.
Full marks require a named winner, a named loser and a mechanism for each. Students who can do that have understood something more durable than a position on trade policy.
How to use this worksheet
The sheet prints on standard letter paper and runs about forty-five minutes. The supply chain diagram supports Part D and works well redrawn on a board with a product the class chooses. In a classroom, Part C makes a good paired sort before the written questions, since two of the claims can be argued either way.
For related material, our social studies worksheets cover supply and demand, decolonization and climate policy. The World Integrated Trade Solution database holds real trade and tariff figures for any pair of countries, which makes a good extension for students who want numbers behind Part E.
Practise globalization terms online
Answer these five questions and check them instantly. They use the same ideas as the printable sheet.
- A tax charged on imported goods is called what?
- Contracting work to an outside firm abroad is called what?
- A group of states that lower trade barriers among themselves is a trade what?
- How many supply chain stages are shown in the diagram?
- Competition to attract investment by cutting standards is a race to the what?