Population Pyramids Worksheet
This population pyramids worksheet gives Grade 9 and Grade 10 students 26 marks of practice on reading age structure.
This population pyramids worksheet gives Grade 9 and Grade 10 students 26 marks of practice on reading age structure, including two calculations and the reason a falling birth rate does not stop a population growing.
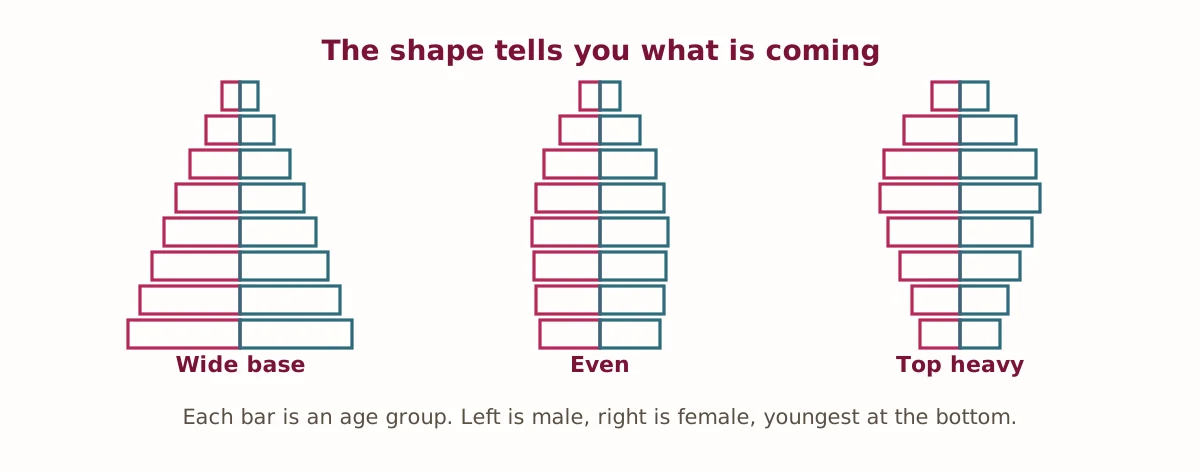
What the population pyramids worksheet covers
A population pyramid shows how a population divides by age and sex. Each bar is an age group, usually in five-year bands, with the youngest at the bottom, males on the left and females on the right. The shape is simultaneously a summary of a country's recent history and a forecast of its near future, which is what makes it worth teaching.
A very wide base means a high birth rate and a young population. It also means growth will continue for decades even if birth rates fall sharply tomorrow, because those children have not yet had children of their own. A narrow base with heavy upper bands means the reverse: an ageing population, with a shrinking working-age group supporting a growing retired one.
Neither shape is good or bad in itself. Each creates a different set of problems — schools, housing and jobs at one end, pensions and health care at the other — and Part C asks students to read four shapes and say what each one implies.
Two calculations worth doing by hand
Part D asks for natural increase and a dependency ratio. Natural increase is birth rate minus death rate: 28 minus 9 gives 19 per 1,000, which is 1.9% a year before any migration is counted. The dependency ratio needs more care — students have to work out the working-age population first by subtracting both dependent groups from the total, and a surprising number subtract only one.
The worked solutions in the key show every step, because these are the kind of calculations where a student who gets the wrong answer usually has one specific misunderstanding worth finding rather than a general weakness.
Population momentum
Part E asks why a population keeps growing after its birth rate falls. The answer is momentum: a large young generation has not reached childbearing age yet, so even at a lower rate per woman, far more women are having children than there are people dying. It is counterintuitive and it is the single most useful idea on the sheet, because it explains why demographic policy takes decades to show results.
The final question asks for a policy response to an ageing population and a drawback of it. Raising the retirement age is unpopular and hard on people doing physical work. Encouraging immigration is politically contested and requires housing and services. Encouraging higher birth rates is slow, expensive and historically not very effective. The key marks the pairing rather than the choice, because every available option has a real cost.
How to use this worksheet
The sheet prints on standard letter paper and needs a pencil and a calculator for Part D. The answer key gives full working for both calculations. In a classroom Part E works well as a discussion after the calculations are marked; for homeschool use the whole sheet runs about forty-five minutes.
For related material, our social studies worksheets cover migration, urbanization and climate across the grades. The International Database from the US Census Bureau draws a live population pyramid for any country and year, which makes an excellent follow-up activity.
Practise population pyramids online
Answer these five questions and check them instantly. They use the same ideas as the printable sheet.
- On a population pyramid, which age group is at the bottom?
- Birth rate minus death rate gives what?
- A very wide base shows a high what rate?
- A country with birth rate 28 and death rate 9 has what natural increase per 1,000?
- A narrow base and heavy upper bands shows what kind of population?