Accuracy and Precision
This accuracy and precision worksheet gives Grade 9 and Grade 10 students 26 marks of practice on reading real scales.
This accuracy and precision worksheet gives Grade 9 and Grade 10 students 26 marks of practice on reading real scales, finding the estimated digit, and telling random error from systematic error.
What the accuracy and precision worksheet covers
Counting digits in a printed number is the easy half of significant figures. The hard half is deciding how many digits a reading is entitled to in the first place, and that is settled at the instrument rather than on paper. Almost every worksheet on this topic skips it, which is why this one is built around four drawn scales.
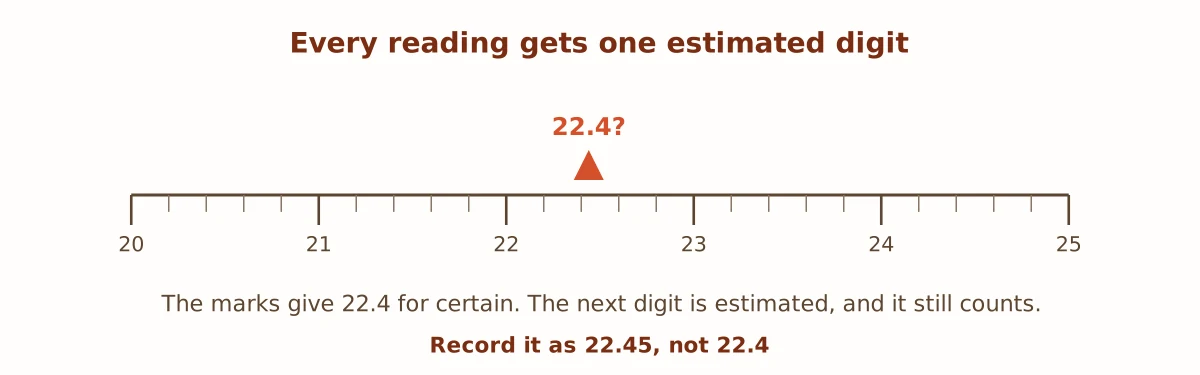
The rule is the same for every analogue scale: write down every digit the marks give you for certain, then estimate one more between them. A cylinder marked every 1 mL is read to the nearest 0.1 mL. The estimated digit is uncertain, but it is significant, and leaving it off reports less than the instrument can do. Recording 24 mL from a cylinder that can give 24.0 mL throws away a figure.
Four instruments, four different answers
Part A gives a ruler marked every 0.1 cm, a graduated cylinder marked every 1 mL, a thermometer marked every 2 °C and a burette marked every 0.1 mL. Each one is read to a different precision, so students cannot apply a single remembered number of decimal places and have to work from the divisions in front of them.
The burette is included deliberately. Its scale runs downwards from zero at the top, because it measures what has been delivered rather than what remains, and students read it upside down the first several times they meet one. The meniscus is drawn as a curve on both liquid instruments, since reading from the bottom of the curve is part of the skill.
Accuracy and precision are different questions
Accuracy is how close a reading is to the true value. Precision is how close repeated readings are to each other. The two are independent, which is the point of the four target diagrams in Part C: a set of readings can be tightly grouped and completely wrong.
That case matters most. Tight grouping around the wrong value is a systematic error — a balance that was never zeroed, an object weighed in its container — and no amount of repeating helps, because every reading is pushed the same way. Random error scatters on both sides of the truth, so averaging more readings does reduce it. Part D asks students to explain that difference, which is the idea the whole topic rests on.
How to use this worksheet
The sheet prints on standard letter paper and runs about thirty minutes. It works well immediately before a first lab, because every mistake it covers is one students are about to make with real equipment in front of them.
Once the readings are recorded, the next question is how many figures survive a calculation. Our significant figures calculator applies the rule at each step and shows the working, and the rest of our science worksheets cover the arithmetic. The NIST guidance on SI units sets out how measured values and their uncertainties should be written.
Practise accuracy and precision online
Answer these five questions and check them instantly. They use the same ideas as the printable sheet.
- A cylinder is marked every 1 mL. To the nearest what should you estimate? (in mL)
- Readings that agree with each other but not with the true value are described as what?
- How many significant figures should a burette reading of 22.40 mL have?
- Which kind of error does averaging more readings reduce?
- A ruler marked every 1 mm is estimated to the nearest what, in mm?